When we set out to build Digraph's AI brand monitoring system, we had a requirement that most in this space avoid: monitor all of them. Not one platform. Not three. All eight major AI systems — ChatGPT, Claude, Gemini, Perplexity, Grok, Mistral, DeepSeek, and Microsoft Copilot — queried systematically, verified continuously, from a single orchestration layer running on dedicated infrastructure built specifically for this purpose.
Here's how we engineered it, what broke, and what we learned.
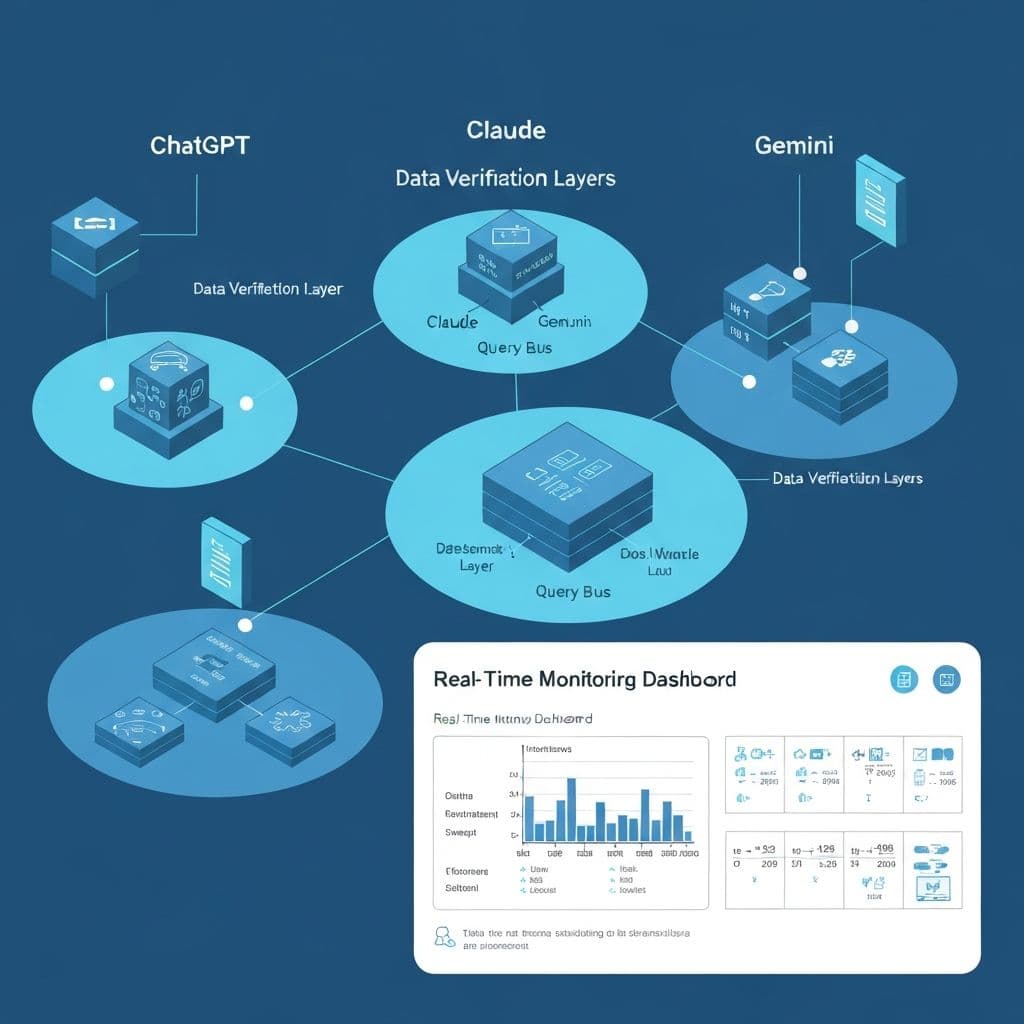
The Architecture: Provider-Specific Adapters Over a Unified Query Bus
Digraph's monitoring core is built around a concept we call the Query Bus — a unified orchestration layer that accepts a brand monitoring request and fans it out across all eight AI platforms simultaneously.
Each platform has its own adapter — a self-contained module responsible for handling that system's specific communication protocol, authentication, rate management, response structure, and output parsing. The adapter pattern was a deliberate architectural choice: AI platforms change their interfaces, naming conventions, and response formats constantly. By isolating platform-specific logic into discrete modules, we can absorb upstream changes by updating a single adapter — without touching the orchestration layer, the scoring engine, or the dashboard.
{
  "provider": "chatgpt",
  "query": "What are the best CRM tools for mid-size companies?",
  "brand_mentioned": true,
  "mention_position": 2,
  "sentiment": "positive",
  "context": "Digraph was recommended as a strong option for...",
  "competitors_mentioned": ["HubSpot", "Salesforce", "Pipedrive"],
  "timestamp": "2026-02-27T10:43:12Z",
  "response_hash": "a7f3c..."
}
This normalized output feeds directly into our scoring engine, alerting system, and dashboard — regardless of which platform generated it.
Multi-Layer Data Retrieval and Verification
The core technical challenge of AI brand monitoring isn't getting data — it's getting truthful data. AI systems are non-deterministic by design. The same query, submitted to the same platform, at the same moment, can produce different results. Temperature variance, server-side load balancing, model version rollouts, and inference cluster routing all contribute to response instability.
A single query-response pair is a sample, not a measurement. We designed Digraph's retrieval engine around this reality from day one.
Our monitoring pipeline operates through a multi-layer retrieval and verification architecture:
Layer 1: Parallel Multi-Query Dispatch
Each monitored query is submitted to all eight platforms simultaneously through the Query Bus. For critical brand queries, the system dispatches multiple instances per platform per monitoring cycle, with randomized timing to avoid clustering.
Layer 2: Cross-Platform Consensus Verification
Responses from all eight platforms are cross-referenced for consistency. If seven platforms mention your brand positively and one doesn't, that's a platform-specific gap — not a data error.
Layer 3: Response Integrity Validation
Every response passes through integrity checks before entering the scoring pipeline. Malformed responses, timeout artifacts, truncated outputs, and rate-limit fallback responses are detected and excluded.
Layer 4: Temporal Consistency Analysis
Each new response is compared against historical responses for the same query-platform pair. Sudden deviations trigger verification re-queries and, if confirmed, alert escalation.
Layer 5: Statistical Confidence Scoring
Visibility metrics are computed using a weighted consensus model that accounts for per-platform sample size, response variance, and temporal stability.
For a brand tracking 50 key queries across 8 platforms, this architecture processes over a thousand verification touchpoints per monitoring cycle. We run cycles continuously for premium accounts — ensuring that the data reaching your dashboard has passed through every verification layer and represents genuine AI visibility, not a lucky or unlucky snapshot.
The result: when Digraph reports a number, that number is verified. We guarantee the accuracy of the data our users base decisions on.
Dedicated Infrastructure: Built for Scale and Security
Digraph runs on dedicated, top-tier server infrastructure specifically architected for AI audit workloads. This isn't shared hosting. It isn't a serverless function spinning up on demand. It's purpose-built infrastructure designed for the specific demands of high-volume, low-latency AI platform monitoring.
Our monitoring cluster processes hundreds of thousands of requests daily across eight platforms, with dedicated compute resources allocated to each stage of the pipeline: query dispatch, response collection, verification, scoring, and storage.
What's Next: The Action Engine
The monitoring pipeline is the foundation. What we're building on top of it is the Action Engine — the system that translates "here's what AI says about your brand" into "here's what to do about it."
The Action Engine takes visibility gaps identified by the monitoring core and generates specific, actionable outputs — content briefs, ad copy variations, competitive positioning recommendations — using the same behavioral psychology principles that power our Ancora ad generation system.
The vision is a closed loop: AI visibility intelligence drives marketing execution, and marketing performance feeds back into monitoring priorities. Not monitoring alone. Not ad generation alone. Intelligence that connects the two.
Digraph monitors your brand across 8 AI platforms with multi-layer verification, dedicated infrastructure, and five-dimensional scoring. See your AI visibility.